Skip to content

Port congestion is the operational state where vessel arrivals, container dwell, and inland transfer capacity exceed a terminal’s throughput, forcing ships to anchor offshore and pushing freight rates upward through surcharges, equipment imbalance, and detention fees. Between 2021 and 2026, ports across the United States, Europe, and Asia have moved through extreme bottlenecks, recovery, and a fresh wave of disruption tied to the Red Sea, the Panama Canal, the Baltimore Key Bridge collapse, and the October 2024 ILA strike. This guide explains the mechanics that connect terminal queues to ocean freight rates and outlines the current state shippers should plan around in 2025 and 2026.
What Port Congestion Actually Is
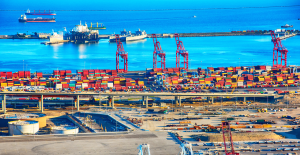
A port acts as a transfer node where ocean vessels exchange containers with trucks, rail, and barges. Throughput depends on berth length, ship-to-shore cranes, yard space, chassis availability, gate hours, and downstream rail and warehouse capacity. When any of these layers saturates, vessels wait at anchor and containers sit longer on terminal ground. The result is measured in two numbers: anchor queue length and container dwell time. During the 2021 to 2022 peak, the Los Angeles and Long Beach complex hit 109 vessels at anchor in October 2021, with import dwell of 8 to 14 days. Carriers passed those costs to shippers as General Rate Increases, Peak Season Surcharges, and equipment imbalance fees, while detention and demurrage clocks ran on every box stuck in the yard.
Why Congestion Pushes Freight Rates Up
Vessel time at anchor is fixed cost without revenue, so carriers compensate by tightening capacity and raising rates on the next sailings. Three mechanisms drive the price increase. First, capacity absorption: a ship waiting 10 extra days off Los Angeles is a ship not arriving in Shanghai for the next loading window, removing slots from the rotation. Second, equipment imbalance: empty containers pile up at congested ports and run short at origin, triggering Equipment Imbalance Surcharges. Third, detention and demurrage: free time at a US terminal is typically 4 to 7 days, after which charges of $75 to $300 per container per day accrue. Across a peak congestion cycle, the combined effect has historically added $500 to $1,500 per 40-foot container on transpacific lanes.
Major US Ports and Their Capacity
Five US gateways concentrate most container volume and define where congestion shows up first.
- Los Angeles and Long Beach: roughly 17 million TEU per year combined, the dominant Pacific gateway and the entry point for most China and Southeast Asia volume.
- New York and Newark: about 9 million TEU per year, the dominant Atlantic gateway serving the Northeast consumer base.
- Savannah: around 5.5 million TEU per year and the fastest-growing US container port, anchored by deep-water access and Southeast distribution.
- Houston: roughly 4 million TEU per year, the Gulf gateway with Panama Canal direct services and strong Mexico cross-border flow.
- Seattle and Tacoma: about 3.5 million TEU per year combined under the Northwest Seaport Alliance, the main hub for Alaska and the Pacific Northwest.
2023 Normalization After the Pandemic Peak
By the second half of 2023, San Pedro Bay queues had cleared, dwell had returned to 2 to 4 days, and spot rates had collapsed below pre-pandemic levels. Carriers responded with blank sailings to defend rates, and labor uncertainty eased after the ILWU and Pacific Maritime Association reached a tentative West Coast contract in mid-2023. Shippers who had diverted volume to the East Coast during the 2021 to 2022 crunch began rebalancing, although a structural share of cargo stayed on USEC routings.
The 2024 Disruption Cluster
Three events in 2024 reset the congestion map.
Red Sea attacks and Suez Canal diversion. Sustained Houthi attacks on commercial shipping cut Suez Canal traffic by 50 to 60 percent. Carriers rerouted around the Cape of Good Hope, adding 7 to 14 days to Asia to Europe and Asia to USEC voyages and absorbing fleet capacity equivalent to a meaningful share of global tonnage. Spot rates on Asia to North Europe and Asia to Mediterranean lanes more than doubled in the first half of 2024.
Baltimore Key Bridge collapse. On March 26, 2024, the Francis Scott Key Bridge collapsed after a containership strike, closing the Port of Baltimore for 11 weeks. Roughly 1.2 million tons of cargo, especially autos and roll-on roll-off, were diverted to New York, Norfolk, and Philadelphia, tightening capacity at those alternative gateways.
ILA East and Gulf Coast strike. The International Longshoremen’s Association struck from October 1 to October 3, 2024, closing every USEC and Gulf port from Maine to Texas. A short tentative wage deal ended the walkout, and the parties reached a full master contract in January 2025, but the threat of disruption kept many shippers front-loading via the West Coast through the second half of 2024.
Panama Canal Drought and the 2025 to 2026 Picture
Through 2023 and into 2024, low water at Gatun Lake forced the Panama Canal Authority to cap daily transits and reduce maximum draft, shifting some all-water Asia to USEC services back toward Suez or West Coast plus rail. Rains restored Gatun Lake in 2025, transit slots normalized, and tolls auctions cooled. Heading into 2026, the main rate-moving variables are Red Sea reopening risk, USEC port labor compliance with the new ILA contract, and intermodal rail capacity at Los Angeles and Long Beach where BNSF and Union Pacific control the inland leg.
Congestion Drivers Beyond Volume
Volume alone does not create congestion. Vessel size matters: ultra-large container vessels of 18,000 to 24,000 TEU need deeper draft, longer berth windows, and more cranes per call, concentrating workload. Labor capacity matters: the ILWU 2022 to 2023 negotiations and the 2024 ILA strike both produced slowdowns even before formal job action. Chassis shortages at intermodal hubs strand boxes on the ground, and rail capacity at the Los Angeles and Long Beach on-dock and near-dock yards has repeatedly become the binding constraint. Warehouse dwell at the receiver end closes the loop, because boxes that cannot be unloaded keep chassis and yard slots locked.
Surcharges Tied to Congestion
Shippers see congestion in their invoices through a recurring set of line items. General Rate Increases reset base ocean rates upward. Peak Season Surcharges apply during the August to October window. Equipment Imbalance Surcharges appear when empties are stranded at the wrong end of the trade. Demurrage covers containers held at the terminal beyond free time, and detention covers containers held outside the terminal beyond free time. Combined demurrage and detention exposure on a delayed shipment can exceed the underlying ocean freight cost on short-haul moves. For a deeper view of how carriers structure these layers, see how shipping lines work and what impacts your freight rates, and for the policy layer see how US tariffs impact freight rates and trade costs.
How Forwarders Mitigate Congestion Risk
A digital freight forwarder reduces exposure on four levers. Vessel routing flexibility lets shippers compare multiple carriers and services on the same lane in real time. Alternate ports shift volume from Los Angeles and Long Beach to Oakland or Seattle and Tacoma when San Pedro Bay slows, or from New York and Newark to Norfolk or Savannah during USEC events. Inland mode shifts move cargo from rail to truck when intermodal yards back up. Faster customs clearance and pre-arrival filings shorten free-time consumption. Off-peak vessel windows avoid the Friday and Monday gate spikes at the largest terminals.
Plan Around Congestion, Not Through It
Port congestion is structural, not cyclical, and the 2024 to 2026 window has shown how a single event in the Red Sea or at the Key Bridge can reshape rates across every major lane. Build buffer days into transit plans for China to US trade lanes, validate alternate gateways before peak season, and price detention and demurrage exposure into the landed cost. Compare instant ocean and air freight rates on the lanes that matter most, including China to US and Germany to USA. Explore ocean freight services or get an instant quote at exfreight.com.